Teaching with Technology – Zoom and Excel
Teaching with Technology: Zoom-Based Modeling and Forecasting with Real U.S. Data
In Intermediate Macroeconomics, I designed a Zoom-based workshop where students learned how to model, interpret, and forecast U.S. economic performance using real-world macroeconomic indicators. Beyond academic learning, this experience gave students hands-on skills with Excel and data analysis—skills that are equally valuable in graduate research and in professional roles such as consulting, finance, and policy analysis.
1. Bridging Theory and Application
Economic growth theory can feel abstract. To make it tangible, I created a session that directly connected models with real data:
- Students explored exponential growth models, regression-based forecasting, and growth accounting;
- We worked with U.S. GDP, capital, and employment data (1948–2023):contentReference[oaicite:0]{index=0};
- Students built and tested these models themselves inside Excel, seeing results update live.
By engaging in applied modeling, students strengthened their ability to:
- Understand long-run growth patterns;
- Interpret macroeconomic models in real policy contexts;
- Apply basic econometric reasoning to real data.
These are transferable skills students can highlight in graduate school applications or in job interviews where data literacy and problem-solving are essential.
2. Implementation via Zoom and Excel
The workshop combined real-time demonstration with active practice:
- I shared my screen to walk students through GDP trend analysis using exponential and polynomial models:contentReference[oaicite:1]{index=1}:contentReference[oaicite:2]{index=2};
- Students worked with an Excel file I distributed beforehand, applying each step themselves;
- I showed how to linearize an exponential model with natural logs and then estimate regressions inside Excel;
- We interpreted coefficients, evaluated forecast accuracy, and debated the policy relevance of different growth scenarios.
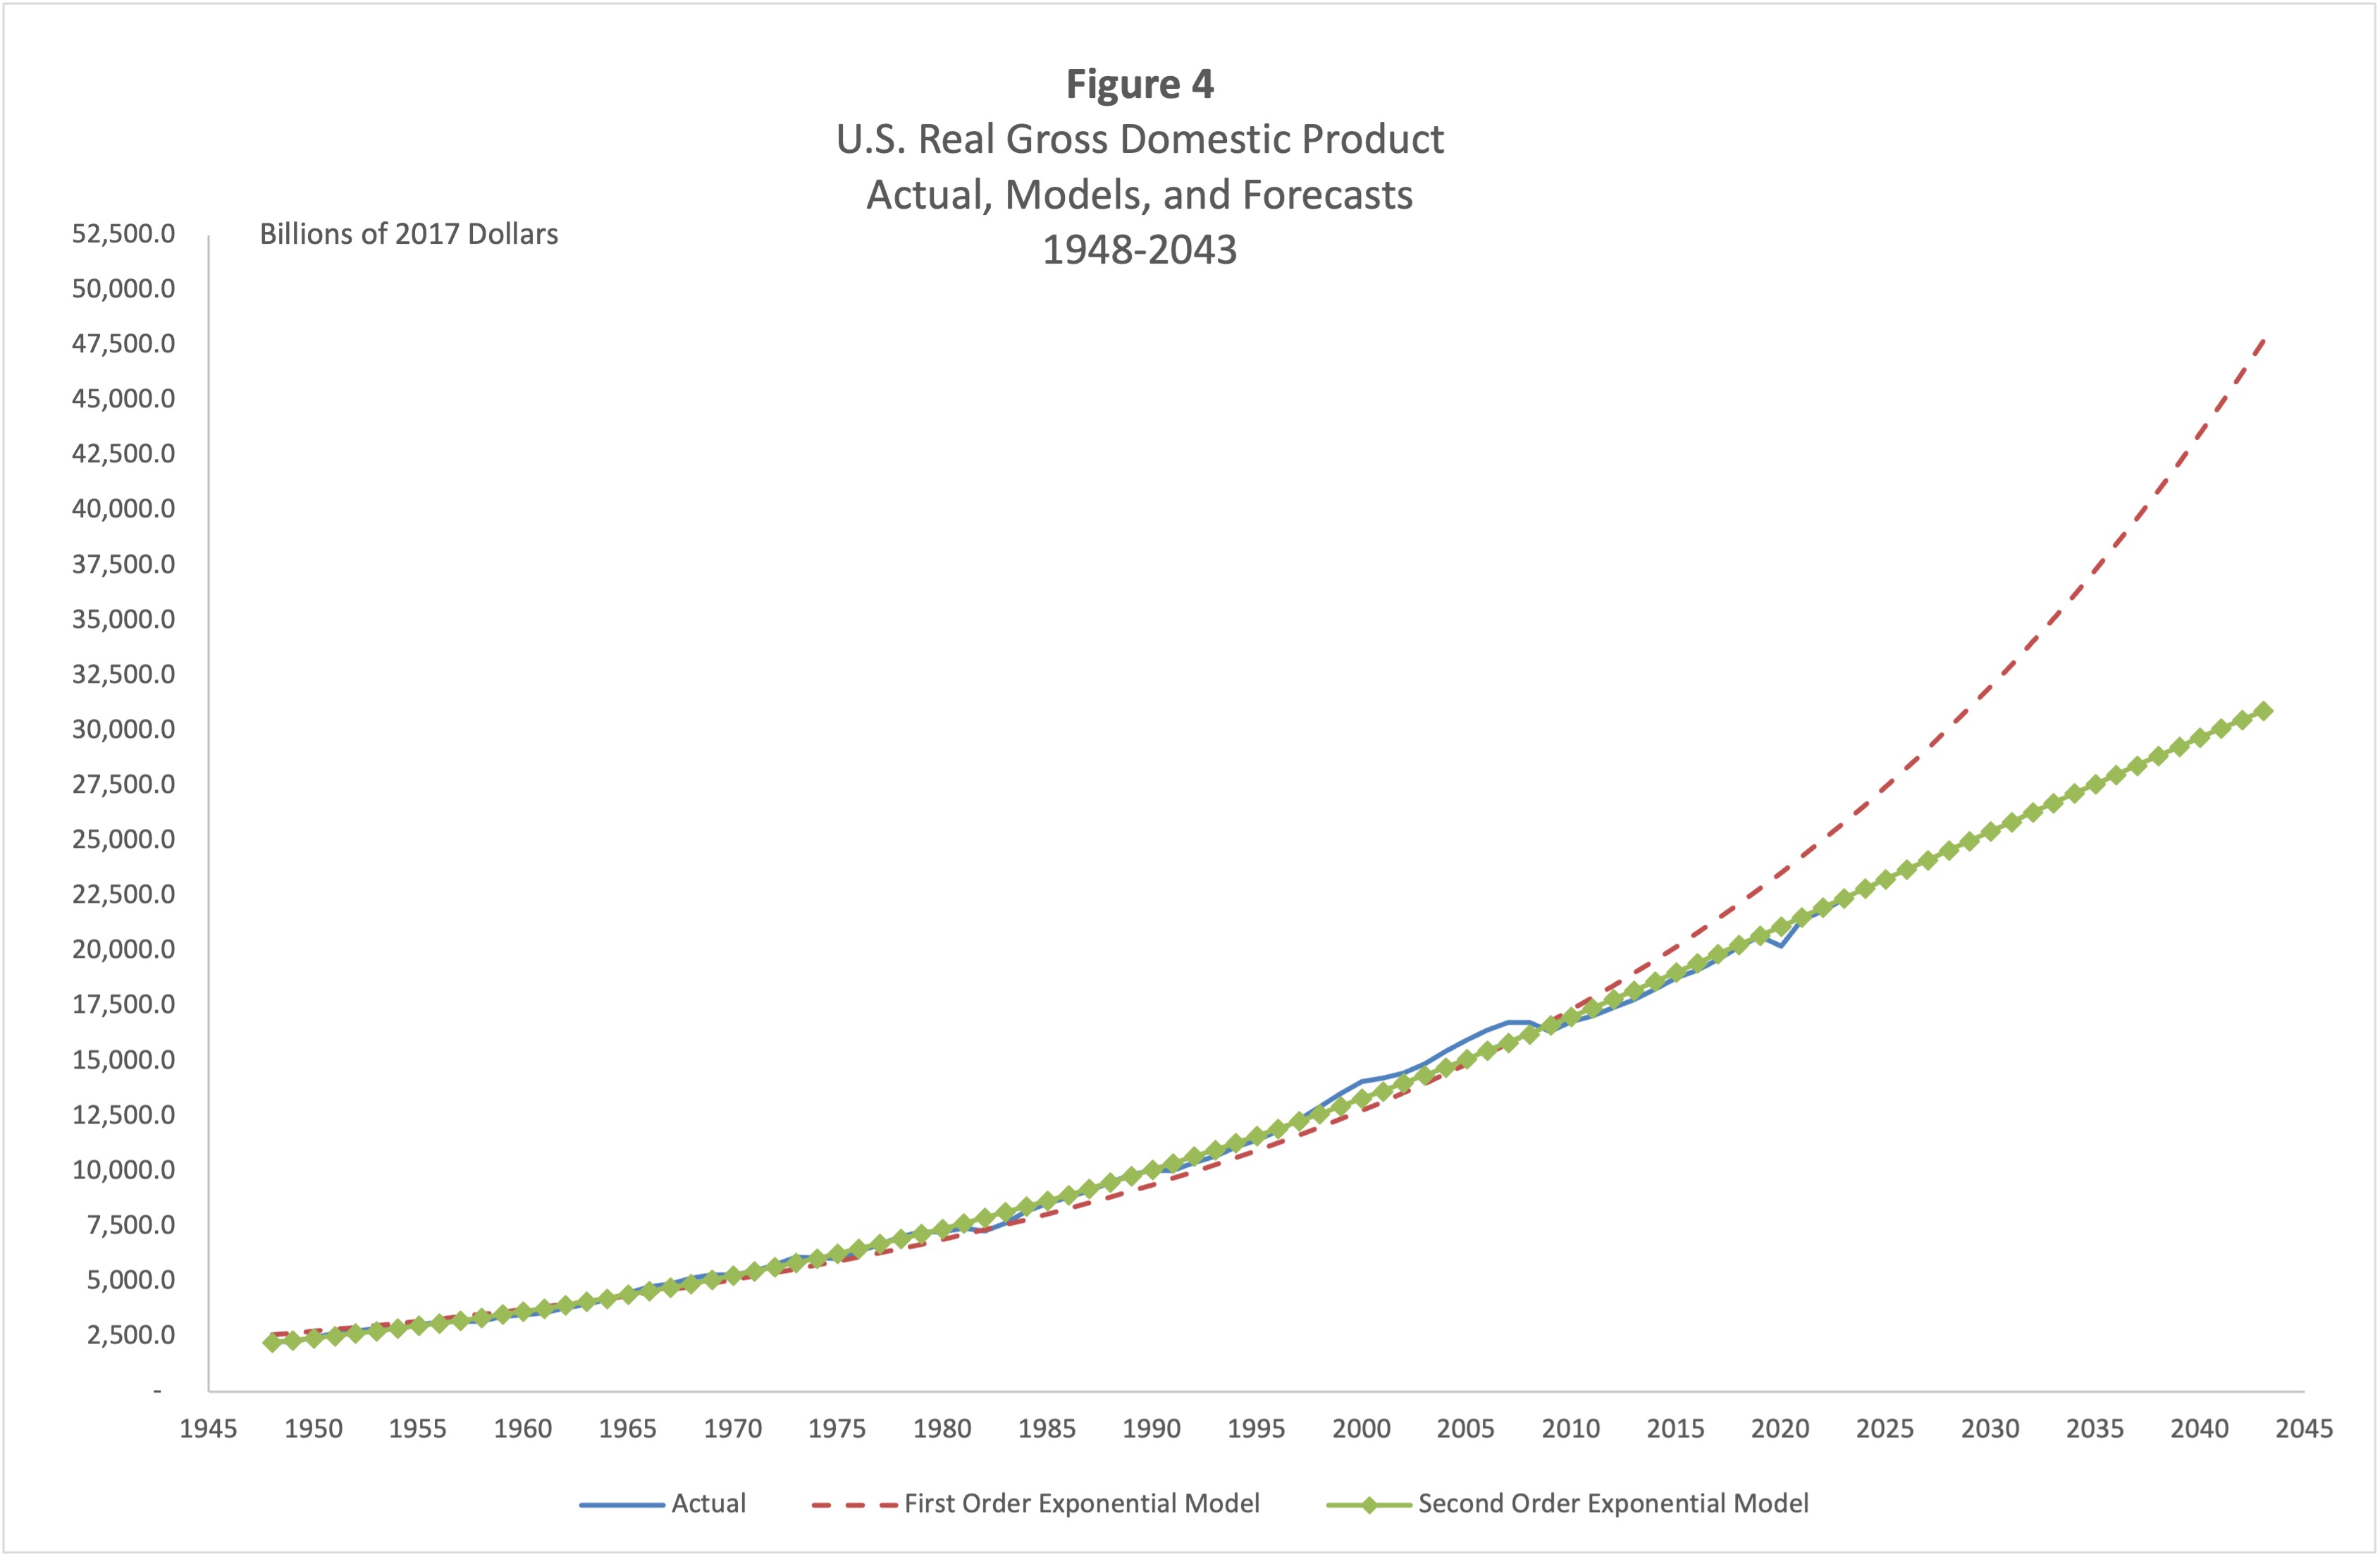
Figure: U.S. Real GDP (1948–2023) and Forecast Using Exponential Trend
This style of interactive teaching mirrors how analysts and researchers work in practice—collaborating on shared screens, testing model variations, and interpreting real-time results.
3. Outcomes and Reflection
Students found this session highly applicable:
- Over 80% reported that it improved their ability to connect theory to data;
- Several integrated forecasting exercises into their final projects, simulating the kind of analysis required in graduate-level research or professional settings.
What worked well
- Step-by-step walkthroughs with live edits;
- Real-time Excel practice lowered the barrier to applied econometrics;
- Zoom chat discussions encouraged interactive interpretation.
Challenges
- Excel version differences occasionally caused hiccups in regression replication;
- Some students experienced Zoom connectivity disruptions.
Next Steps
- I plan to prerecord modules so students can pause and review at their own pace;
- Template files with embedded formulas will reduce technical difficulties;
- I will build short Canvas quizzes to reinforce comprehension of models and forecasts.
4. Transferable Skills for Graduate School and Careers
This workshop was not just about learning macroeconomics—it was about practicing skills students can showcase beyond the classroom:
- Data analysis and visualization: Employers and graduate programs value proficiency in Excel and data interpretation.
- Quantitative reasoning: Regression modeling and growth forecasts show students can handle applied econometrics.
- Communication of results: Explaining data trends and model outcomes mirrors tasks in consulting, policy briefs, and academic research.
By highlighting these experiences, students can demonstrate both technical competence and analytical thinking—key traits sought by graduate schools and employers alike.